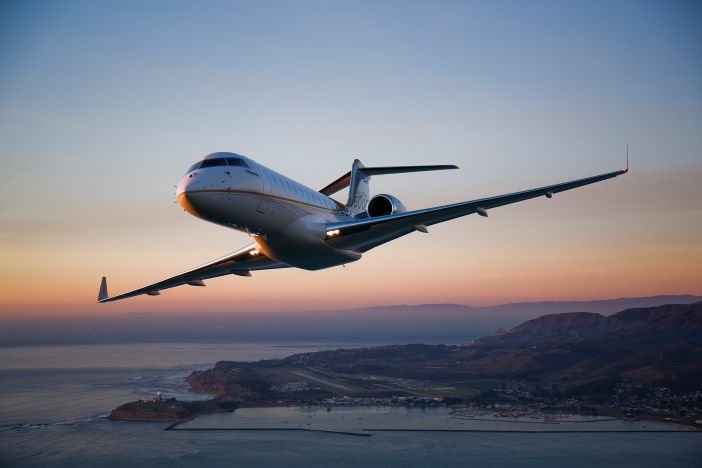
Visitors braving the baking desert sun to visit Bombardier’s National Business Aviation Association (NBAA) static display at Henderson Executive Airfield, Las Vegas, last October, were treated to the kind of opportunity seldom granted. The Canadian manufacturer’s team was on hand, inviting attendees onto a pedestal, from which they could not only reach the wingtip of the Global 6000 demonstrator, but were actively encouraged to see just how much they could move it up and down.
Your correspondent is happy to confirm that the trial of strength versus Global 6000 wing, as measured in real time by Bombardier’s Flex-O-Meter, a huge transparent protractor, was a joyous thing indeed. ‘Flexible wing = Smooth ride’ and ‘#IFlexedTheWing’, writ large on the Flex-O-Meter, hinted at the serious purpose of the setup, demonstrating a particular quality of the Global 6000 wing and complemented by a model simulation nearby.
Striking in its simplicity, being more Airfix than PlayStation, the simulation featured a pair of semi-anonymous aircraft models ‘flying’ one behind the other, each atop a post. The posts moved up and down, the amplitude of their motion replicating exactly the movement of a Global 6000 and competitor aircraft as they flew through the same air mass.
The Global’s movement was noticeably less pronounced, although both aircraft at times moved when the other didn’t, but just how faithfully did the simulation match reality and where had Bombardier acquired the data?
That question prompted a conversation with the man who led the test, Mathieu St-Cyr, manager of engineering at Bombardier. “We’ve always designed our aircraft for a smooth ride and we get a lot of customer testimonials confirming how smoothly they fly, as well as press reviews from journalists who have flown on them. But it’s always been qualitative information, with no quantitative data to back it up,” says St-Cyr.
Wing flexibility and loading
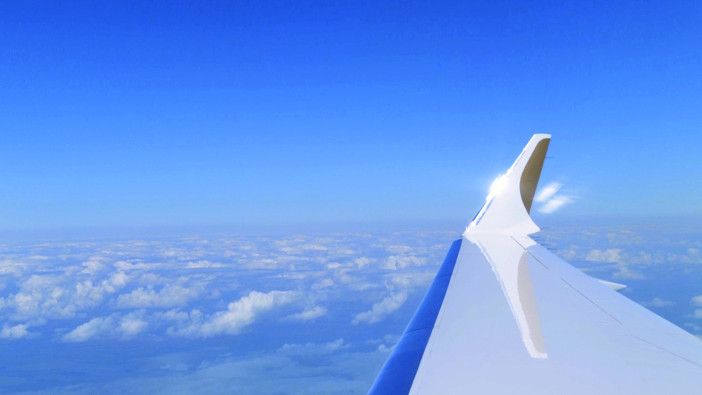
The secret to a smooth ride is a combination of wing flexibility and wing loading, explains St-Cyr. “Wing loading is a simple relationship between wing area and aircraft weight; the analogy we like to use for it is walking in a storm with a small umbrella, compared with a golfing umbrella, where the large one is more likely to offset your balance because the wind has more surface to catch. If two aircraft weigh the same, the one with the larger wing has more chance of being offset by turbulence.
“Meanwhile, a flexible wing absorbs some turbulence, but at the same time offsets the angle of attack, with the result that while the wing moves, the cabin moves less. We know aircraft weight and wing area, so wing loading is easy to calculate, but wing flexibility is less easily quantified.
“We wanted to compare our wing flexibility with that of competitor aircraft and measure the end vibrations that would put quantitative data to the ride quality, while making the comparison as fair as possible. We used laser scanners to measure wing flexibility on the ground and in the air, with accelerometers mounted in the cabins to measure vibration.
“The laser scanners measure a point in space with micrometer accuracy. We scanned on the ground to get accurate data on wing position from outside and inside the airplanes; we knew the windows would make the measurements slightly less precise and now we could asses the deformation the scanners saw as they looked out at the wing in flight.”
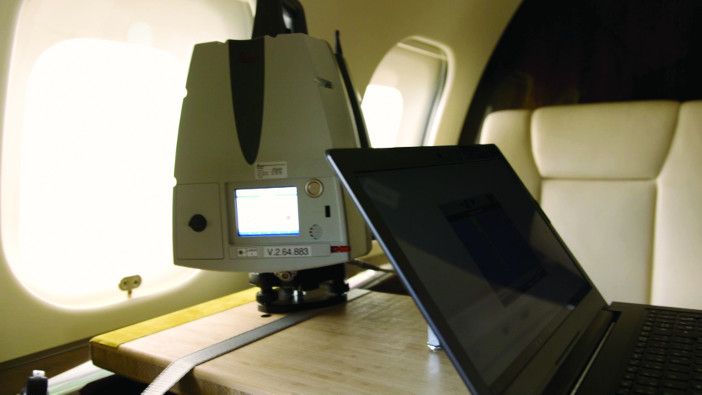
Bombardier custom-designed tables for mounting a laser scanner inside each aircraft without the requirement for permanent cabin modification or damage. St-Cyr explains, “The three-ply bamboo tables were mounted on tripods in the aft cabin, positioned so that the scanner looked out of a cabin window. We used the aircraft seatbelts to secure the platforms so solidly that they didn’t move at all. The seats are certified for 16g impact, so with the tables effectively connected to the seat tracks, the table movement was less than 0.1mm.
“The laser scanners produced a 3D scan of each wing so that we knew the deflection at each point and we used that data to produce a CFD model. It showed that at 1g, our wing was 15% more flexible than the competitor’s.” The model also helped generate the data that translated into the physical movements of the pole-mounted models at NBAA. In order to quantify wing loading, St-Cyr’s team measured cabin vibration via identical accelerometers to those used in the Global 7000 flight test program. “They’re extremely precise and pick up any vibration,” he says.
“We mounted them in four identical locations in each aircraft cabin – one in the left-hand forward-facing seat track, another immediately behind the cockpit seats, a third at another cabin seat, and the final one in the back of the aircraft.”
Flying the test
“We performed the same laser scan on both aircraft while pulling 1g turns, measuring the wing deflection of each. It was important for us to get exactly the same air, so we flew them one right after the other, as close as was achievable with regular crews and aircraft, rather than test pilots and test aircraft. We flew them five minutes apart from take-off to the test point, with our aircraft initially taking the lead.
“It needed a lot of coordination. The two crews were in constant contact to ensure they were following accurately and, to be as fair as possible, midway through the test we swapped the positions. We wanted to know if wake had an effect; we didn’t think it did, but we made the swap to see – the data proved we were correct and we were able to repeat the variability. When it showed a bump, it was quite striking to see how the trailing aircraft reacted to the same bump five minutes later.”
Since wing loading varies with aircraft weight, Bombardier was also careful to design a fair comparison in terms of fuel and payload. “We didn’t load them to the same weight, because the two aircraft don’t necessarily fly the same distance. Instead, we loaded them for the same mission – a 3,000 nautical mile trip with eight passengers, landing with NBAA reserves.
Our assessments after fueling the aircraft showed we were 0.3% off our calculated figure for the Global and 0.6% on the competitor aircraft.”
St-Cyr quickly dispels the assumption that the eight passengers actually comprised ballast for simplicity, “They were real people! Flight test engineers were on board monitoring the accelerometers and running the scans, all sitting in the same positions on each aircraft, plus someone in each aircraft’s jump seat coordinating communication between the pilots.” St-Cyr himself flew on the competitor aircraft, and not entirely as ballast – he noted and time-stamped movement as he felt it, for post-flight correlation with the measured data.
“We measured vibration throughout the flight, although we didn’t fly a full 3,000 nautical mile mission. Instead we flew for around two hours, but we knew the loading at take-off was the same, so at the end the change in weight was the same for both.”
Autopilot was engaged as the majority of the measurements were made, eliminating variations in piloting style. Although St-Cyr acknowledges variations may exist in the way that autopilots behave, the focus of the tests was on ride quality, and because aircraft of this type perform the majority of their missions on autopilot, any variation from the autopilot systems ultimately had no effect on the results.
“The smoothness of the ride is really down to wing flexibility and wing loading. Does the autopilot have a part to play? Maybe a little, but not enough to be a major consideration in the overall results.”
Smooth results
The test complete, Bombardier spent around a month analyzing data. “We have software that links the vibration data to the flight data recorder information, including GPS. It’s super-refined, but it takes some time to process. Also, the accelerometers pick up all vibration, so we filtered out anything that wasn’t turbulence. “At 60Hz we found a vibration that was more prominent on the competitor, but we identified it as engine vibration and it, along with some other data, was filtered out. We only kept vibrations that were under 20Hz, although the major vibrations were less than 1Hz – something you can really feel.”
St-Cyr says the process of measurement was in itself important, because it transformed a poorly understood parameter into something tangible. “The amplitude of vibration – how far the aircraft is pushed up and down by turbulence – was between 1.6 and 2.5 times greater on the competitor aircraft than on the Global,” he says. “It’s quite significant and enables us to quantify what customers tell us – that the Global is more comfortable.”
This article was originally published in the June issue of Aerospace Testing International. To read it in its original format and others like it, click here


